

Debugging is an integral part of the application development cycle. When writing programs in Java or any other language, one of the top concerns every developer should address is the availability of a reliable debug facility.
The kind of tool used can make or break the application debugging process, so it is vital to learn what your best options could be depending on the use-case.
In this post, we outline 7 of the best Java debugging tools for 2020. Most of these tools will come in handy when finding, diagnosing, and fixing problems in both development and production environments.
NetBeans
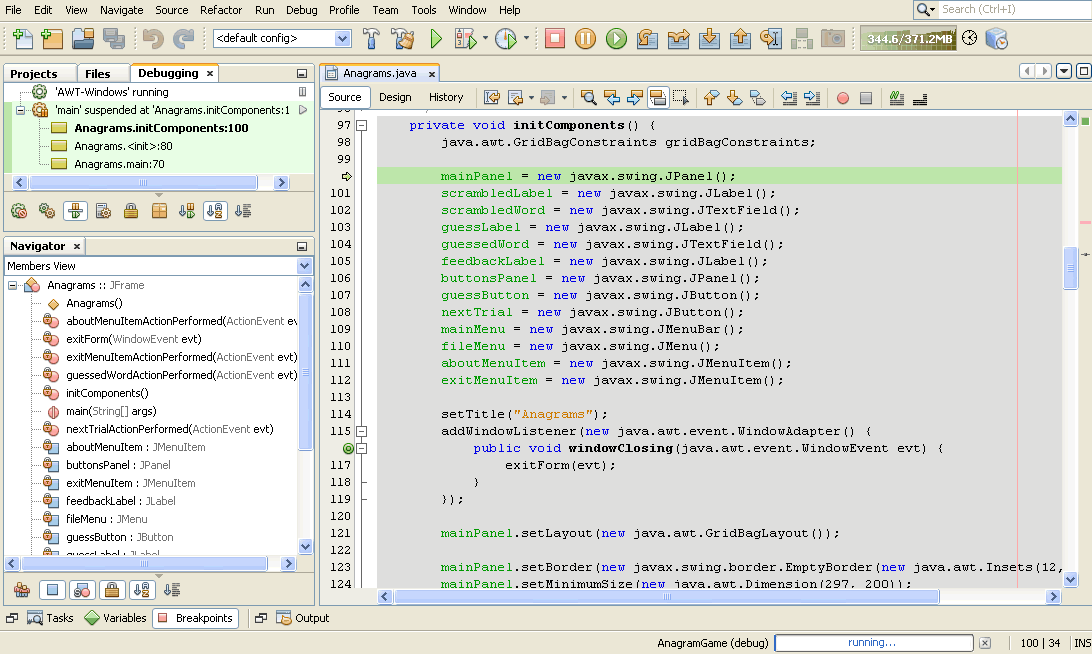
NetBeans is one of the top and most widely used Java IDE that runs on Linux, Windows, MacOS, and Solaris. As expected, it features a visual debugger and code profiler that allows developers to debug executable Java classes, unit tests, and entire projects.
The NetBeans debugger allows you to place breakpoints in your Java code, run into methods, add field watches, monitor execution, and take snapshots during a debug session.
Rookout
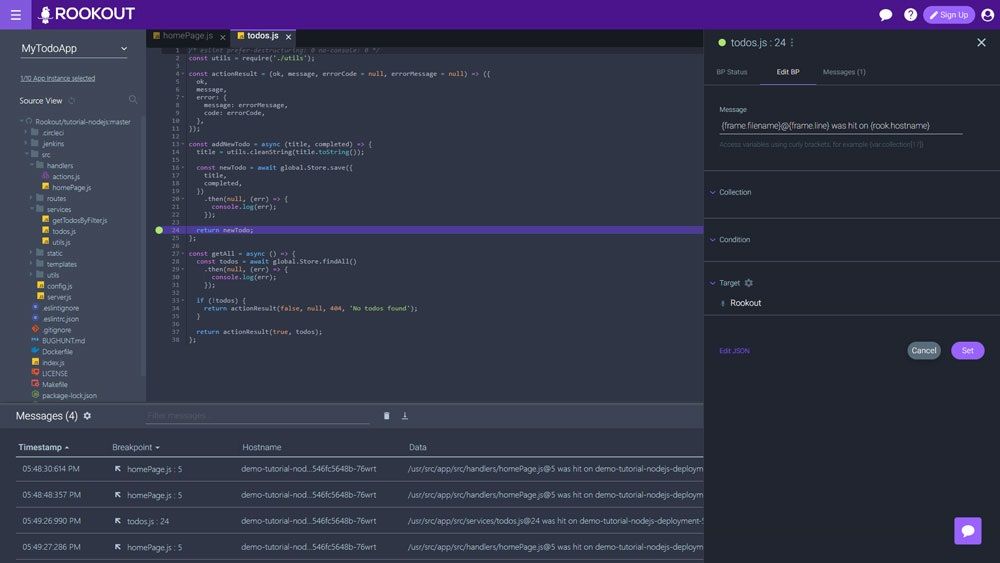
Rookout is a great Java debugging option that works well in development as well as production. It provides robust debugging capabilities across various environments, including both serverless and containers.
Rookout goes beyond the standard debugging capabilities by collecting and pipelining crucial data. This allows developers to understand software execution issues and tackle bugs without the need to write code, redeploy, or restart applications.
With Rookout, developers can eliminate the long, complicated, and resource-intensive process of data exploration and bug hunting.
Eclipse
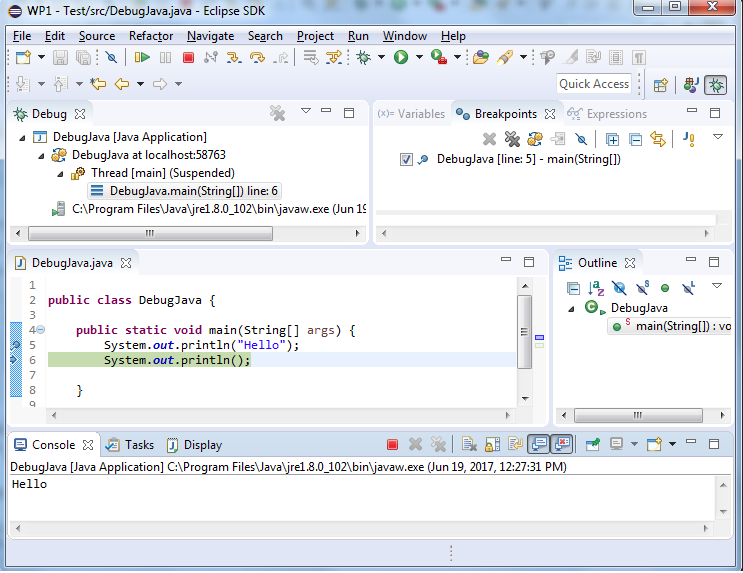
Eclipse is a renowned open-source IDE with a built-in Java Debugger. Since its inception, Eclipse has maintained its reputation as one of the most robust cross-platform IDEs for developing modern applications.
It provides standard debugging functionalities such as the ability to set breakpoints, perform step execution, inspect variables and values, suspend and resume threads, and more.
The Eclipse platform also facilitates remote debugging. While it is mainly a Java IDE, Eclipse debug view also supportS PHP, C, C++, and a host of other programming languages.
IntelliJ IDEA
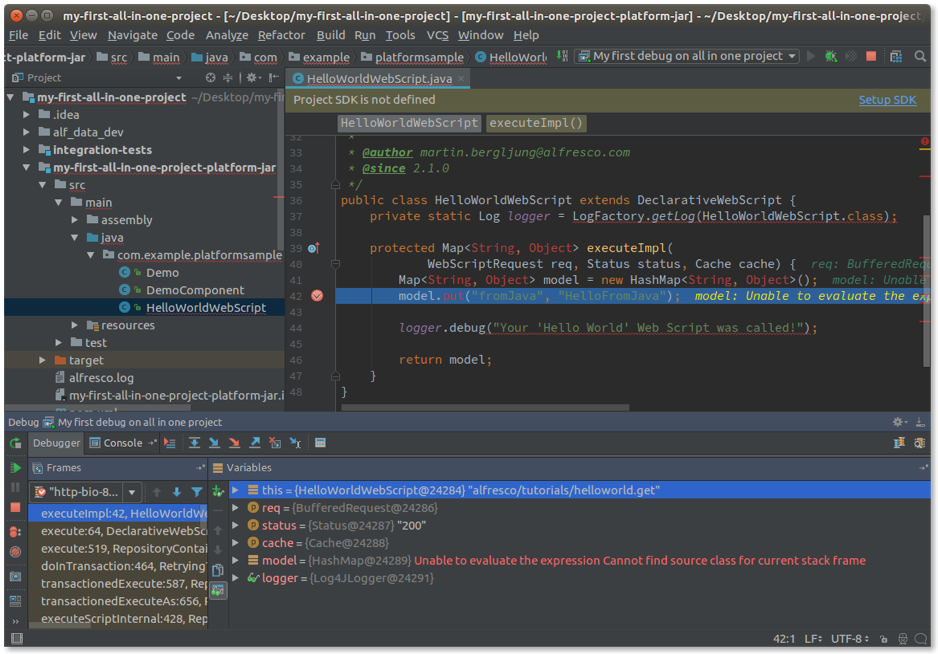
IntelliJ IDEA is a highly popular Java IDE that features a powerful debugger. This tool allows developers to easily debug simple code as well as multi-threaded Java applications.
With the IntelliJ debugger, you can set breakpoints, step through your code, evaluate expressions, inspect variables, and perform a range of other debugging processes. It allows easier detection of unexpected flows and states, deadlocks, livelocks, and more.
At its core, IntelliJ IDEA is designed to improve the workflow and productivity of Java development teams.
Java Debugger (JDB)
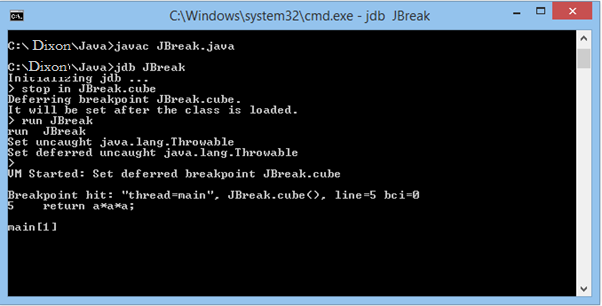
The Java debugger (JDB) is a tool that allows developers to debug java code in the command line. Through the Java Debug Interface (JDI), a high-level front-end interface, developers can detect and fix bugs in their programs. This tool can also be used to inspect and debug code in a remote Java virtual machine.
Like most command-line debuggers, JDB has a learning curve, so it takes time for new users to become comfortable working with JDB. But once you master JDB commands, it will be easy to set breakpoints, step through code, and perform other debugging actions.
Fusion Reactor
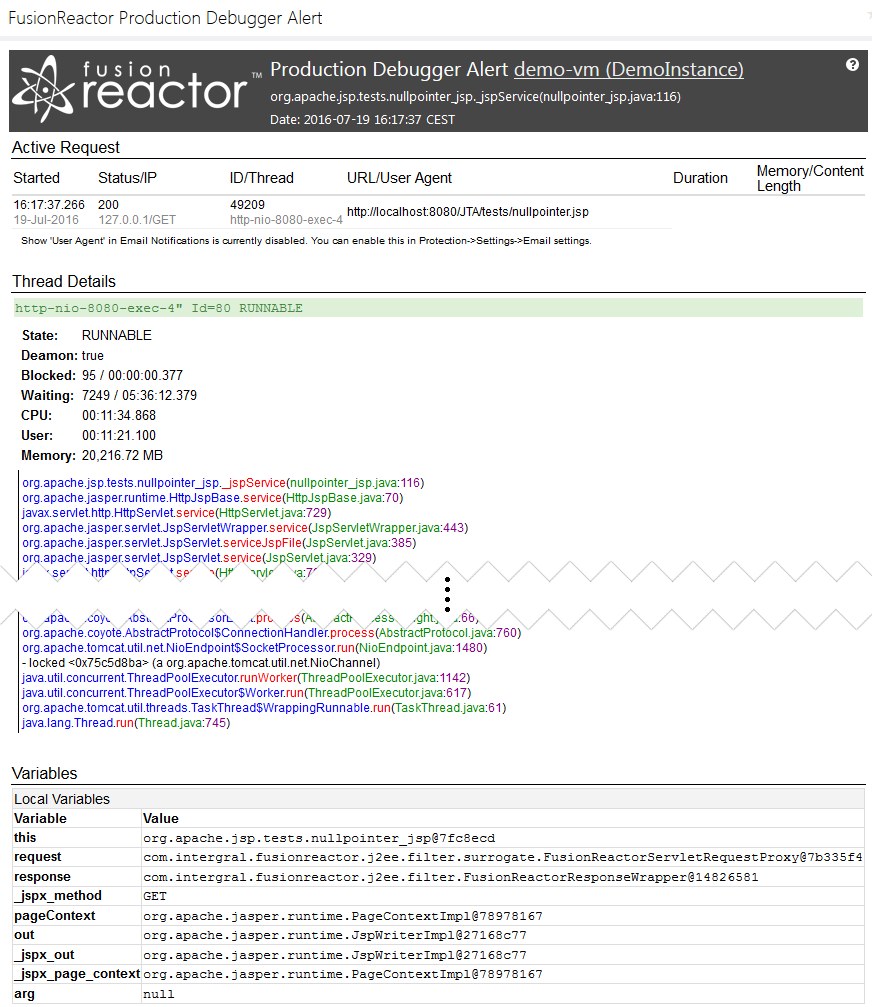
Fusion Reactor is an innovative performance monitoring solution for Java applications in the development, testing, and production environments. This tool is equipped with an impressive set of features that provide everything Java developers want in an APM tool.
The Fusion Reactor Developer Edition lets you develop, test, and analyze applications in a non-production environment. With this tool, it is easier to isolate issues and improve code quality before deploying applications to production.
Another notable feature is the production debugger, which gives developers maximum control as they interact with their code and fix bugs. Fusion Reactor also supports remote debugging.
JDeveloper
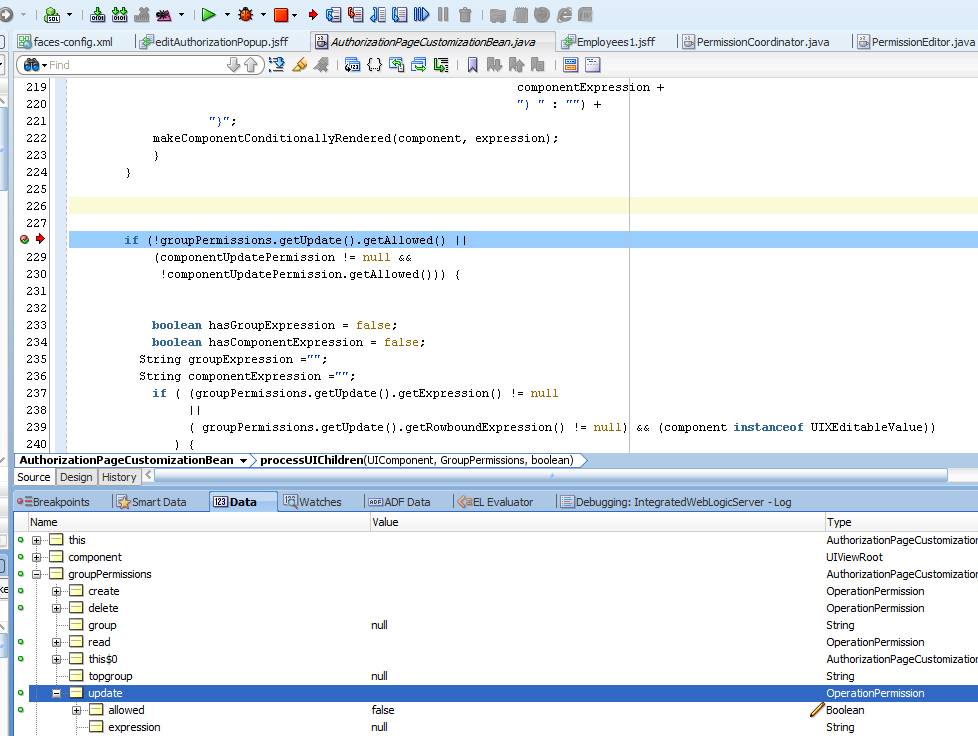
Oracle’s JDeveloper is a freeware IDE that addresses every step of the application development lifecycle, from coding to designing, profiling, debugging, optimization, and deployment.
When debugging with JDeveloper, you can set breakpoints and watchpoints, analyze the call stack, inspect and manipulate variables, and investigate step by step code execution. Other than Java, it can be used to debug HTML, PHP, JavaScript, SQL, and XML.
Now you can go ahead and use the above tools for detecting, diagnosing, and resolving issues in your Java applications with higher speed and efficiency.